ExcelVBA作例9(UV-Vis:経時変化)
- 今回ご紹介するのは、前回までにご紹介した、3回ずつ測定したUV-Visスペクトルから計算した濃度の、平均値と標準偏差の時間変化を集計するマクロになります。
- このマクロを実行するためには、前回までにご紹介した3回平均と標準偏差を計算するマクロを実行したファイルが必要となりますので、まだの方はそちらの記事を先にご覧になってください。

データがそろうとこんな感じ 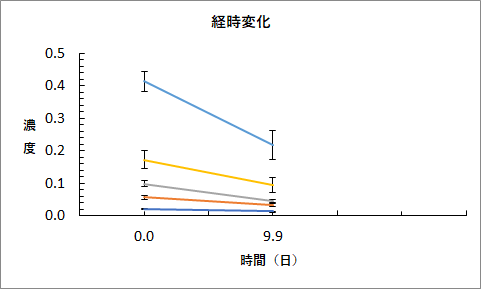
今回はデータが二つだけなのでこんな感じ - まずはこの記事のシリーズの最初でご紹介した検量線を作成するマクロを実行したExcelファイルで、前回の記事でご紹介した3回平均と標準偏差のマクロを実行します
- このファイルは上書き保存をして閉じます
- 新しいExcelブックを開きます。
- 下のマクロを実行します
Option Explicit
Sub 濃度変化()
With Application.FileDialog(msoFileDialogOpen)
.InitialFileName = ActiveWorkbook.Path
.FilterIndex = 2
If .Show = -1 Then
.Execute
Else: GoTo L1
End If
End With
Dim i As Integer
Dim 列番号 As Integer
Dim データセット As Integer
Dim データ番号 As Integer
Dim ブック As Workbook
Dim セット数 As Integer
Workbooks(2).Activate
Worksheets(4).Select
セット数 = Range("E15", Range("E15").End(xlDown)).Rows.Count / 2
Range("E15", Cells(14 + セット数, 5)).Copy Workbooks(1).Worksheets(1).Range("E4")
Workbooks(1).Activate
列番号 = 6
Do While Cells(3, 列番号).Value <> ""
列番号 = 列番号 + 1
Loop
列番号 = 列番号 - 1
For Each ブック In Workbooks
If Not (ブック Is Workbooks(1)) Then
ブック.Activate
Worksheets(2).Select
i = Range("D2").Value
Worksheets(4).Select
データセット = (i - 1) / 3
Range(Cells(15 + データセット, 6), Cells(14 + データセット + データセット, 6)).Copy '平均をコピペ
Workbooks(1).Activate
Worksheets(1).Select
Range(Cells(4, 列番号), Cells(3 + データセット, 列番号)).PasteSpecial xlPasteValues
Workbooks(1).Worksheets(1).Cells(3, 列番号).Value = ブック.Worksheets(1).Range("E1").Value '日付をコピペ
ブック.Activate
Worksheets(4).Select
Range(Cells(15 + データセット, 7), Cells(14 + データセット + データセット, 7)).Copy '標準偏差(濃度)をコピペ
Workbooks(1).Activate
Worksheets(1).Select
Range(Cells(14 + セット数, 列番号), Cells(13 + セット数 + データセット, 列番号)).PasteSpecial xlPasteValues
ブック.Activate
Worksheets(4).Select
Range(Cells(15, 10), Cells(14 + データセット, 10)).Copy '吸着率%をコピペ
Workbooks(1).Activate
Worksheets(1).Select
Range(Cells(24 + セット数 + セット数, 列番号), Cells(23 + セット数 + セット数 + データセット, 列番号)).PasteSpecial xlPasteValues
ブック.Activate
Worksheets(4).Select
Range(Cells(15, 11), Cells(14 + データセット, 11)).Copy '標準偏差(吸着率)をコピペ
Workbooks(1).Activate
Worksheets(1).Select
Range(Cells(34 + セット数 + セット数 + セット数, 列番号), Cells(33 + セット数 + セット数 + セット数 + データセット, 列番号)).PasteSpecial xlPasteValues
ブック.Activate
ブック.Close savechanges:=False
End If
列番号 = 列番号 + 1
Next
Worksheets(1).Select
Range("E4", Range("E4").End(xlDown)).Copy Range(Cells(24 + セット数 + セット数, 5), Cells(23 + セット数 + セット数 + セット数, 5))
Range("F3", Range("F3").End(xlToRight)).Copy Destination:=Cells(23 + セット数 + セット数, 6)
GoTo L2
L1:
Range("F4").CurrentRegion.Select
列番号 = Range("F4").CurrentRegion(Range("F4").CurrentRegion.Count).Column
データセット = Range("F4").CurrentRegion(Range("F4").CurrentRegion.Count).Row - 6
セット数 = データセット
GoTo L2
Exit Sub
L2:
Dim G存在 As Boolean
G存在 = False
Dim シート As Worksheet
For Each シート In Worksheets
If シート.Name = "グラフ" Then
G存在 = True
End If
Next
If G存在 = True Then
Application.DisplayAlerts = False
Worksheets("グラフ").Delete
Application.DisplayAlerts = True
G存在 = False
End If
If G存在 = False Then
Worksheets.Add after:=Worksheets(1)
Worksheets(2).Name = "グラフ"
End If
Worksheets(1).Select
Worksheets(1).UsedRange.Copy
Worksheets(2).Select
Range("E3").PasteSpecial Transpose:=True
Worksheets("グラフ").Select
Range(Cells(3, 5), Cells(3, 5).SpecialCells(xlLastCell)).Sort _
Key1:=Range("E3"), Order1:=xlAscending, _
Orientation:=xlTopToBottom, Header:=xlYes
With ActiveSheet.Shapes.AddChart _
(xlXYScatterLines, 400, 200).Chart
.SetSourceData _
Range(Cells(3, 5), Cells(列番号 - 2, 5 + データセット))
.HasTitle = True
.ChartTitle.Text = "経時変化"
.ChartTitle.Font.Size = 11
.PlotArea.Format.Fill.Visible = False
With .ChartArea.Format.Line
.Visible = msoFalse
End With
With .Axes(xlValue, 1).TickLabels
.Font.Color = RGB(0, 0, 0) '文字色
.Font.Size = 12 'サイズ
End With
With .Axes(xlValue)
.HasTitle = True
.AxisTitle.Text = "濃度[mM]"
.MajorTickMark = xlInside '主目盛内側
.MajorGridlines.Delete '目盛線消去
.MinorTickMark = xlInside '補助目盛内側
With .Format.Line
.Visible = msoTrue
.ForeColor.ObjectThemeColor = msoThemeColorText1
.ForeColor.TintAndShade = 0
.ForeColor.Brightness = 0
.Transparency = 0
End With
End With
With .Axes(xlCategory).TickLabels
.Font.Color = RGB(0, 0, 0) '文字色
.Font.Size = 12 'サイズ
.NumberFormatLocal = "0.0" '表示形式
End With
With .Axes(xlCategory)
.HasTitle = True
.AxisTitle.Text = "時間(日)"
.MajorTickMark = xlInside '主目盛内側
.MinorTickMark = xlInside '補助目盛内側
With .Format.Line
.Visible = msoTrue
.ForeColor.ObjectThemeColor = msoThemeColorText1
.ForeColor.TintAndShade = 0
.ForeColor.Brightness = 0
.Transparency = 0
End With
End With
For データ番号 = 1 To データセット
With .FullSeriesCollection(データ番号) '項目1の設定
.MarkerSize = 8 '・ス}・ス[・スJ・ス[・スフサ・スC・スY
.MarkerStyle = 8 'マーカーを表示(種類:1~9)
.MarkerBackgroundColorIndex = xlColorIndexNone '赤
With .Format.Line
.Visible = msoTrue
.Weight = 1.5
End With
.HasErrorBars = True 'エラーバーを表示
.ErrorBar Direction:=xlY, Include:=xlErrorBarIncludeBoth, Type:=xlCustom, _
Amount:=Range(Cells(4, 15 + データ番号 + セット数), Cells(列番号 - 3, 15 + データ番号 + セット数)), minusValues:=Range(Cells(4, 15 + データ番号 + セット数), Cells(列番号 - 3, 15 + データ番号 + セット数)) 'エラーバーの設定
.ErrorBar Direction:=xlX, Include:=xlErrorBarIncludeBoth, Type:=xlCustom, _
Amount:=0, _
minusValues:=0 'エラーバーの設定
End With
Next
.ChartArea.Format.Fill.Transparency = 0.99
End With
With ActiveSheet.Shapes.AddChart _
(xlXYScatterLines, 1200, 200).Chart
.SetSourceData _
Range(Cells(3, 25 + セット数 + セット数), Cells(列番号 - 2, 25 + セット数 + セット数 + セット数))
.HasTitle = True
.ChartTitle.Text = "経時変化"
.ChartTitle.Font.Size = 11
.PlotArea.Format.Fill.Visible = False
With .ChartArea.Format.Line
.Visible = msoFalse
End With
With .Axes(xlValue, 1).TickLabels
.Font.Color = RGB(0, 0, 0) '文字色
.Font.Size = 12 'サイズ
End With
With .Axes(xlValue)
.HasTitle = True
.AxisTitle.Text = "吸着率%"
.MajorTickMark = xlInside '主目盛内側
.MajorGridlines.Delete '目盛線消去
.MinorTickMark = xlInside '補助目盛内側
With .Format.Line
.Visible = msoTrue
.ForeColor.ObjectThemeColor = msoThemeColorText1
.ForeColor.TintAndShade = 0
.ForeColor.Brightness = 0
.Transparency = 0
End With
End With
With .Axes(xlCategory).TickLabels
.Font.Color = RGB(0, 0, 0) '文字色
.Font.Size = 12 'サイズ
.NumberFormatLocal = "0.0" '表示形式
End With
With .Axes(xlCategory)
.HasTitle = True
.AxisTitle.Text = "時間(日)"
.MajorTickMark = xlInside '主目盛内側
.MinorTickMark = xlInside '補助目盛内側
With .Format.Line
.Visible = msoTrue
.ForeColor.ObjectThemeColor = msoThemeColorText1
.ForeColor.TintAndShade = 0
.ForeColor.Brightness = 0
.Transparency = 0
End With
End With
For データ番号 = 1 To セット数
With .FullSeriesCollection(データ番号) '項目1の設定
.MarkerSize = 8 '・ス}・ス[・スJ・ス[・スフサ・スC・スY
.MarkerStyle = 8 'マーカーを表示(種類:1~9)
.MarkerBackgroundColorIndex = xlColorIndexNone '赤
With .Format.Line
.Visible = msoTrue
.Weight = 1.5
End With
.HasErrorBars = True 'エラーバーを表示
.ErrorBar Direction:=xlY, Include:=xlErrorBarIncludeBoth, Type:=xlCustom, _
Amount:=Range(Cells(4, 35 + データ番号 + セット数 + セット数 + セット数), Cells(列番号 - 3, 35 + データ番号 + セット数 + セット数 + セット数)), minusValues:=Range(Cells(4, 35 + データ番号 + セット数 + セット数 + セット数), Cells(列番号 - 3, 35 + データ番号 + セット数 + セット数 + セット数)) 'エラーバーの設定
.ErrorBar Direction:=xlX, Include:=xlErrorBarIncludeBoth, Type:=xlCustom, _
Amount:=0, _
minusValues:=0 'エラーバーの設定
End With
Next
.ChartArea.Format.Fill.Transparency = 0.99
End With
MsgBox "完了"
Exit Sub
End Sub